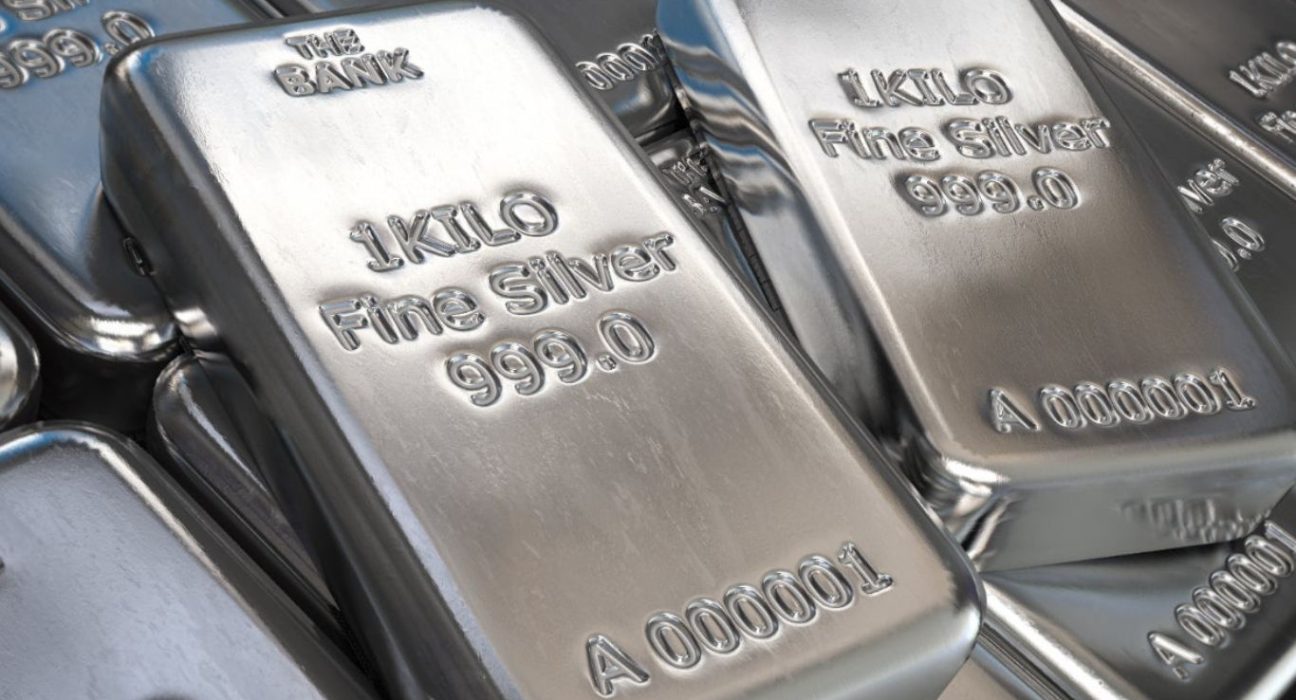
Silver price (XAG/USD) is trading near $26 per ounce, struggling to recover from a 1.5-month low that it reached on Sunday. The precious metal has been under pressure amid a strong US dollar and rising bond yields, which reduce the appeal of non-yielding assets.
Silver Price Drops Below 50-DMA
Silver price fell sharply on Sunday, breaking below the 50-day moving average (50-DMA) for the first time since early April. The metal touched a low of $23.90, which is also the 38.2% Fibonacci retracement level of the rally from March to May.
The decline was triggered by a surge in the US dollar index (DXY), which rose to a two-month high of 90.60 on Friday after a better-than-expected US jobs report. The data showed that the US economy added 266,000 jobs in April, beating the consensus estimate of 978,000.
The strong jobs report boosted the expectations of a faster economic recovery and a possible tapering of the Federal Reserve’s monetary stimulus. This in turn pushed up the US Treasury yields, which reflect the opportunity cost of holding silver.
The 10-year yield rose to 1.60% on Friday, up from 1.53% a week ago. Higher yields make silver less attractive as an alternative investment, especially when compared to interest-bearing assets such as bonds.
Silver Price Faces Resistance Near $26
Silver price managed to bounce back slightly on Monday, but faced resistance near $26, which is a key psychological level and also coincides with the 23.6% Fibonacci retracement level of the recent drop.
The metal is still trading below the 50-DMA, which is now acting as a dynamic resistance at $25.58. The technical indicators are also pointing to a bearish bias for silver.
The relative strength index (RSI) is below 50, indicating a lack of momentum for the bulls. The moving average convergence divergence (MACD) is below the zero line and has crossed below its signal line, suggesting a bearish crossover.
The stochastic oscillator is also in the oversold territory, but has not yet shown any signs of a bullish reversal.
Therefore, silver price may face more downside pressure in the near term, unless it can reclaim the 50-DMA and break above $26 convincingly.
On the downside, the first support level is at $23.90, which is the recent low and the 38.2% Fibonacci retracement level. A break below this level could open the door for further losses towards $23, which is the 50% Fibonacci retracement level and also a horizontal support zone.
Below $23, the next support level is at $22.10, which is the 61.8% Fibonacci retracement level and also coincides with the 200-day moving average (200-DMA).
On the upside, the first resistance level is at $26, which is the 23.6% Fibonacci retracement level and also a psychological barrier. A break above this level could trigger some short-covering and push silver price towards $27, which is another round number and also nears the 20-day moving average (20-DMA).
Above $27, the next resistance level is at $28, which is the recent high and also close to the upper boundary of a descending channel that has been forming since February.


