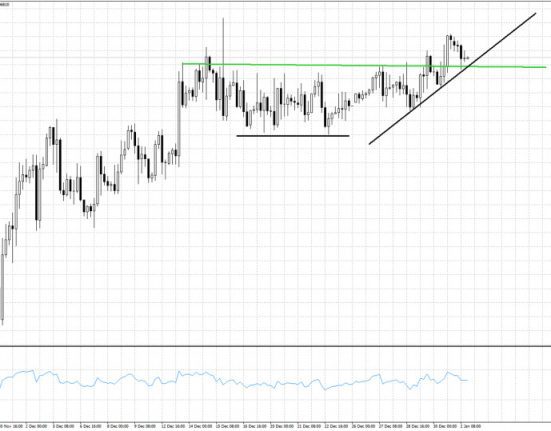
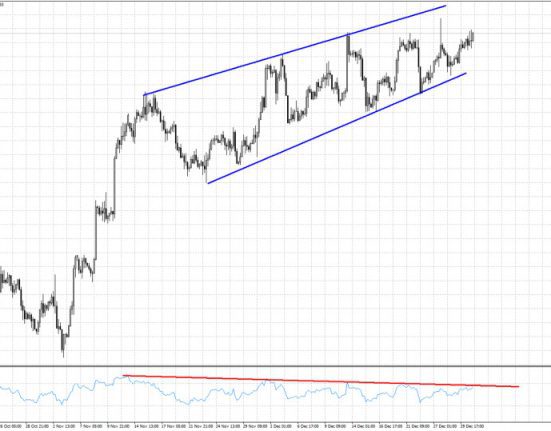
Short-term technical analysis on Gold for January 2nd, 2022.

Bullish channel is depicted by blue lines. Bearish RSI divergence (red line) The current price of gold is about $1,823. As long as price is trading within the bullish channel, the short-term outlook is bullish. Price continues to make higher highs and lows while staying within the lower boundary of.

Read More

Short-term technical analysis on EURUSD for January 2nd, 2022.

Support trend lines are denoted by black lines. Resistance at the green line (broken) The EURUSD pair is currently trading around 1.0680 after successfully breaking over the short-term resistance level of 1.0660 last week. Price re-tested the level at which it had previously broken out, and it has since begun.

Read More

New year, but nothing new for Bitcoin.

Trading ranges denoted by red lines At the beginning of the year, the price of one bitcoin is approximately $16,700. The price remains rangebound inside the trading range it has been confined to since November. Price has not made any significant movement either up or lower in recent exchanges. Bitcoin.

Read More

Indicator analysis: EUR/USD daily review on January 2, 2023

Analysis of Trends (Fig. 1) From the close of the daily candle on Friday at 1.0706, EUR/USD could begin a bearish movement into the 1.0673 support level (thick white line). After a check, it’ll start climbing again, this time to the upper fractal level of 1.0773. (yellow dotted line). Fig..

Read More