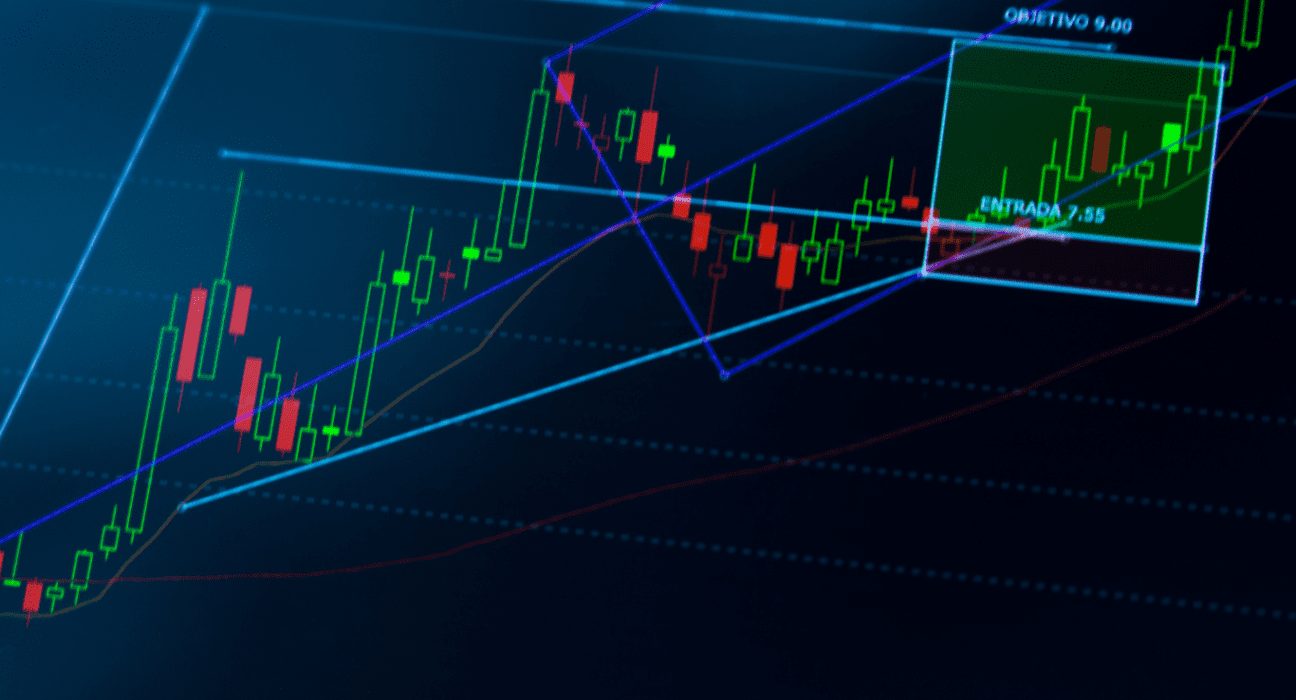
Chart patterns are visual representations of market trends. These patterns can help you predict the future direction of prices by identifying key areas on a chart where the price has been halted or has reversed, thereby creating a functional pattern that is easy to identify visually on the chart. In this article, we will explore three of the most common chart patterns: triangles, head and shoulders, double tops and bottoms, and how to use them to inform your trading decisions.
Triangles
A triangle is a pattern that forms when the price of a stock is confined within two converging trend lines. There are three types of triangles: symmetrical, ascending, and descending. A symmetrical triangle is a pattern where the two trend lines converge at a similar rate, and the pattern is often considered a continuation pattern. An ascending triangle is a pattern where the upper trend line is horizontal, and the lower trend line is upward-slanting, indicating that the stock is in an uptrend. A descending triangle is the reverse of an ascending triangle, with the upper trend line downward-slanting and the lower trend line horizontal.
Before you use any pattern, you should always check the validity of the pattern and make sure that it is still valid. This can be done by considering price action around the trend lines and confirming that this has occurred on a micro scale within the overall trend. The buy and sell rules are based upon bullish or bearish breakouts above or below the trend lines. If your stock follows a similar pattern and breaks out accordingly, you will be able to trade profitably.
Head and Shoulders
The head and shoulders pattern is a reversal pattern that forms after an extended uptrend. The pattern is named after its distinctive shape, with a peak (the head) and two lower peaks (the shoulders) on either side. The neckline is a horizontal line that connects the lows of the two shoulders.
To use the head and shoulders pattern in your trading, you should look for a clear breakdown of the neckline. If the price breaks down below the neckline, this is a bearish signal, and you should consider selling the stock. The target price for a head and shoulders pattern is equal to the distance from the head to the neckline, projected from the point of the neckline breakdown.
Double Tops and Bottoms
A double-top pattern forms when an asset’s price rises to a peak, and then fall more than halfway back down before rising again to reach the same level as that second peak. A double bottom pattern is identical, but it rises less than halfway before falling and then reaching another approximate high.
To use double tops and bottoms in your trading, you should look for a clear breakout of the pattern. If the price breaks out above the peak in a double bottom, this is a bullish signal, and you should consider buying the stock. If the price breaks out below the trough in a double top, this is a bearish signal, and you should consider selling the stock. The target price for a double top or bottom is equal to the distance from the pattern to the breakout point, projected from the point of the breakout.
Conclusion
Chart patterns are powerful tools that can help you make informed trading decisions. By understanding how to identify and use triangles, head and shoulders, and double tops and bottoms, you can maximize your trading potential. However, it is important to remember that chart patterns are just one part of a comprehensive trading strategy and should be used in conjunction with other technical and fundamental analyses. As always, it is important to do your own research and seek professional advice before making any investment decisions.
Charts patterns are a valuable tool that can provide traders with insight into market trends and help inform their trading decisions. By using triangles, head and shoulders, and double tops and bottoms, traders can identify potential trading opportunities and make informed decisions based on the patterns they observe. However, it is important to always consider other factors such as market conditions, economic data, and company performance before making any trades.


