Trading in the stock market can be a lucrative opportunity to grow your wealth, but it also comes with its fair share of risks. Identifying key levels of support and resistance can help traders make informed decisions about buying and selling.
Technical analysis is a tool traders use to study market data and make predictions about future price movements. In this article, we’ll explore how identifying key support and resistance levels can impact trading decisions.
What Are Support and Resistance Levels?
Support and resistance levels are critical areas on a stock chart that traders use to predict future price movements. These levels are determined by analyzing past market data to identify areas where the price of a security has either found support, meaning it has consistently bounced back up after hitting a low, or encountered resistance, meaning it has consistently struggled to break through a certain price point.
Support levels are typically seen as a stock’s “floor,” and resistance levels are considered its “ceiling.” When a stock reaches a support level, it is expected to rebound and move higher. Conversely, when a stock reaches a resistance level, it is expected to stall and potentially move lower.
How to Identify Key Support and Resistance Levels
- Trendlines
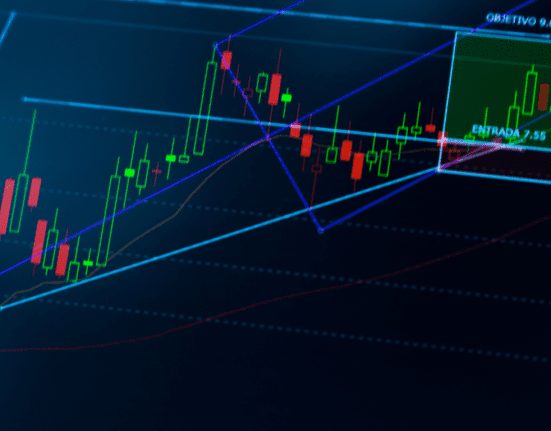
One of the most straightforward ways to identify support and resistance levels is to use trendlines. A trendline is a line drawn on a chart that connects two or more price points and helps you determine whether a stock’s price movement will continue in its current direction, or reverse.When connecting the lows of a stock’s price movement, a downward-sloping trendline can be used to identify potential support levels. Conversely, when connecting the highs of a stock’s price movement, an upward-sloping trendline can be used to identify potential resistance levels.
- Moving Averages
Another popular method of identifying support and resistance levels is the moving average. A moving average is an indicator that averages price over a certain period of time, such as 10 days or 50 days.
When the stock’s price is above its moving average, it is considered to be in an uptrend. Conversely, when the stock’s price is below its moving average, it is considered to be in a downtrend. Moving averages can also act as support and resistance levels, with the stock’s price potentially bouncing off its moving average.
- Previous Highs and Lows
Previous highs and lows can also serve as key levels of support and resistance. When a stock’s price reaches a previous high, it may struggle to break through that level and encounter resistance. On the other hand, if a stock’s price falls to a previous low, it may find support and bounce back up.
- Round Numbers
Round numbers, such as $50 or $100, can also act as psychological levels of support and resistance. These levels can be particularly important for stocks that are trading at or near a round number.
Why Are Support and Resistance Levels Important?
Support and resistance levels are critical components of a trader’s technical analysis toolkit because they can provide key insights into the stock’s future price movements. By identifying these levels, traders can make informed decisions about when to buy and sell, potentially maximizing their profits and minimizing their risks.
For example, a trader may decide to sell their position before the stock encounters resistance and potentially moves lower. On the other hand, they may decide to buy more of the stock before it bounces back up.
In addition, support and resistance levels can be used to set stop-loss orders. A stop-loss order is an order to sell a stock automatically when it reaches a certain price, limiting losses in the event that the stock falls below that level. By placing a stop-loss order at a key level of support, a trader can limit their potential losses if the stock falls below that level.
Conclusion
In conclusion, identifying key levels of support and resistance is an important part of technical analysis for traders. By using tools such as trendlines, moving averages, previous highs and lows, and round numbers, traders can make informed decisions about when to buy and sell and limit their potential losses. With practice and experience, traders can master the art of using support and resistance levels to their advantage and potentially reap the rewards of successful trading.