The financial markets can be a complex and confusing world for those who are new to trading. One of the most important concepts in trading is support and resistance. Support and resistance refer to certain price levels that can either prevent an asset from falling below a certain point (support) or prevent an asset from rising above a certain point (resistance). In this article, we will explore what support and resistance are, how they are calculated, and how traders use them to make investment decisions.
What are Support and Resistance?
Support and resistance are key price levels that traders watch to determine the future direction of an asset’s price. Simply put, support is the price level at which an asset is likely to find buying interest, preventing its price from falling further. On the other hand, resistance is the price level at which an asset is likely to find selling pressure, preventing its price from rising further.
Support and resistance levels are price points at which an asset’s price usually reverses direction. Traders use these levels to help them make decisions about when to buy or sell an asset.
How are Support and Resistance Calculated?
While the calculation of support and resistance levels is not an exact science, there are several common methods traders use to determine these levels. These include:
- Historical price levels – This method involves looking at previous price data to identify areas where the price of an asset has bounced back from in the past.
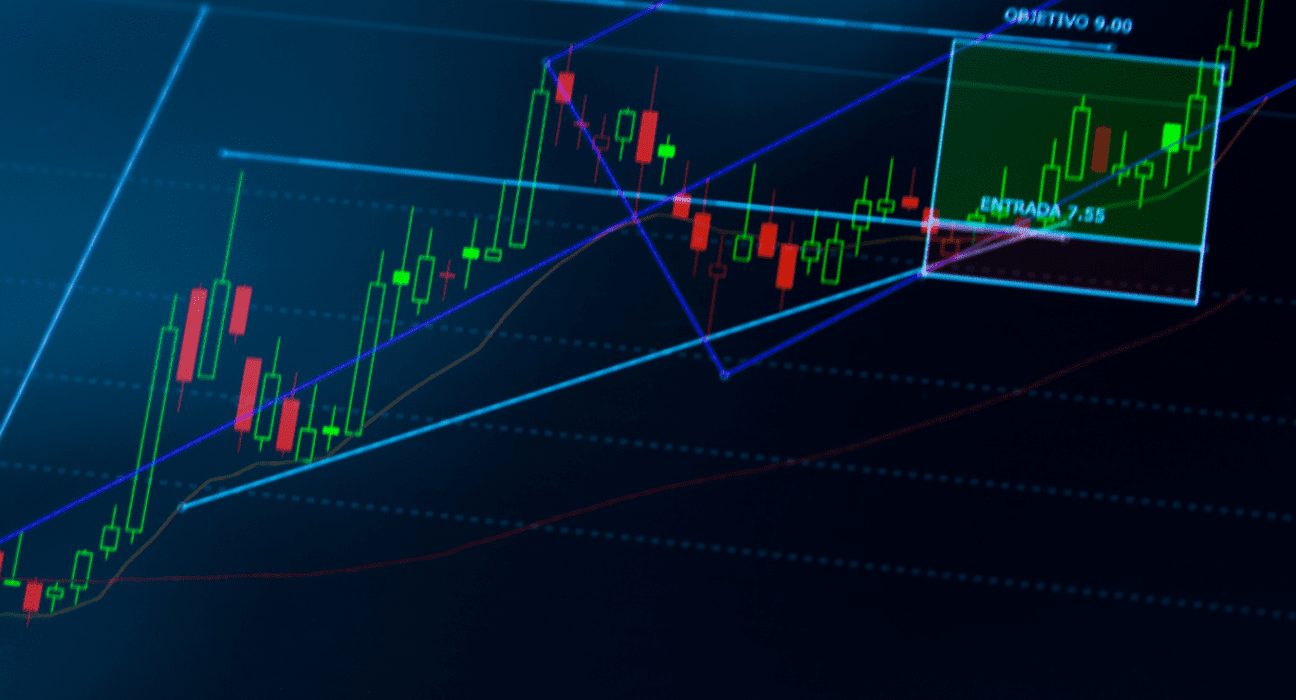
- Trend lines – This method involves drawing a line connecting two or more price points and using it to identify potential support and resistance levels.
- Moving averages – This method involves calculating the average price of an asset over a certain period of time, and using that average as a potential support or resistance level.
- Fibonacci retracements – This method involves using the Fibonacci sequence to identify potential levels of support and resistance based on the size of a recent price move.
Why are Support and Resistance Important?
Support and resistance levels are important because they can provide traders with valuable information about the future direction of an asset’s price. A support level is a price at which an asset tends to rebound after it has fallen below that level; traders may see it as a buying opportunity when the asset is approaching its support level. A resistance level is a price at which an asset tends to struggle as it approaches that level; traders may see it as a selling opportunity when the asset is approaching its resistance level.
In addition, support and resistance levels can provide traders with a way to manage their risk. For example, a trader may place a stop-loss order below a support level to limit further losses if the price does fall below that level.
How to Use Support and Resistance in Trading?
Traders can use support and resistance levels in a variety of ways, including:
- Identifying potential entry and exit points – Traders can use support and resistance levels to determine when to enter or exit a trade, based on the expected price action at those levels.
- Setting stop-loss orders – Traders can use support and resistance levels to determine where to place stop-loss orders, which are orders that automatically close a trade if the price moves in an unfavorable direction.
- Determining profit targets – Traders can use resistance levels to determine where to take profits, as the price is likely to face selling pressure at those levels.
Conclusion
Support and resistance levels are important concepts for traders, providing valuable information about the future direction of an asset’s price. By understanding these levels, traders can make more informed investment decisions and manage their risk more effectively. There is no one-size-fits-all approach to determining support and resistance levels; however, by combining a variety of methods–such as applying trendlines or moving averages–and using them in conjunction with other forms of analysis, traders can gain a better understanding of the market and improve their chances of success.