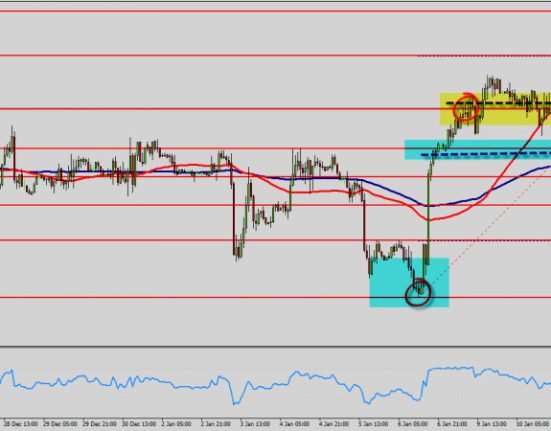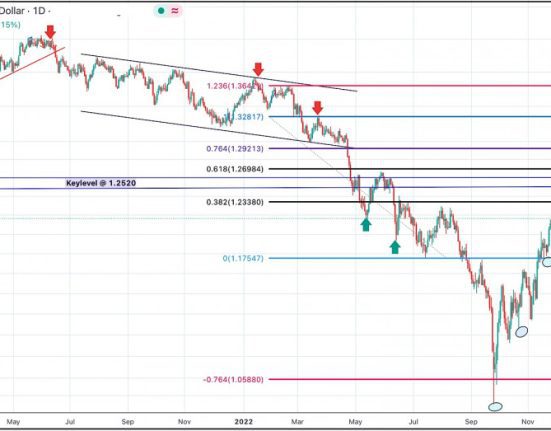
Today’s gold price of $1886 was a new high. The blue lines represent the bullish channel. The black line represents the bearish divergence.
The gold price did not follow the RSI today. The RSI continues to form lower highs and gives bearish divergence signals. The upper boundary of the channel is close to the price now. We believe the upside potential is limited and a pullback towards $1,840 is likely.
So, aggressive traders should short gold at current prices, while less aggressive traders should remain neutral.