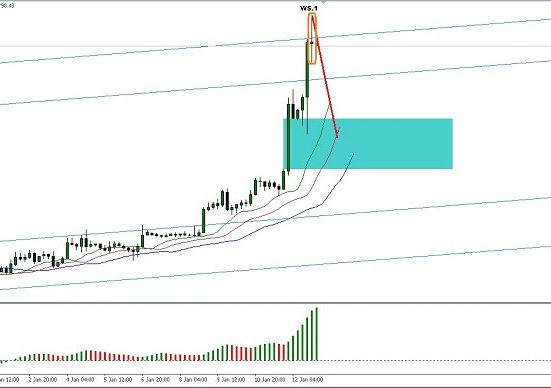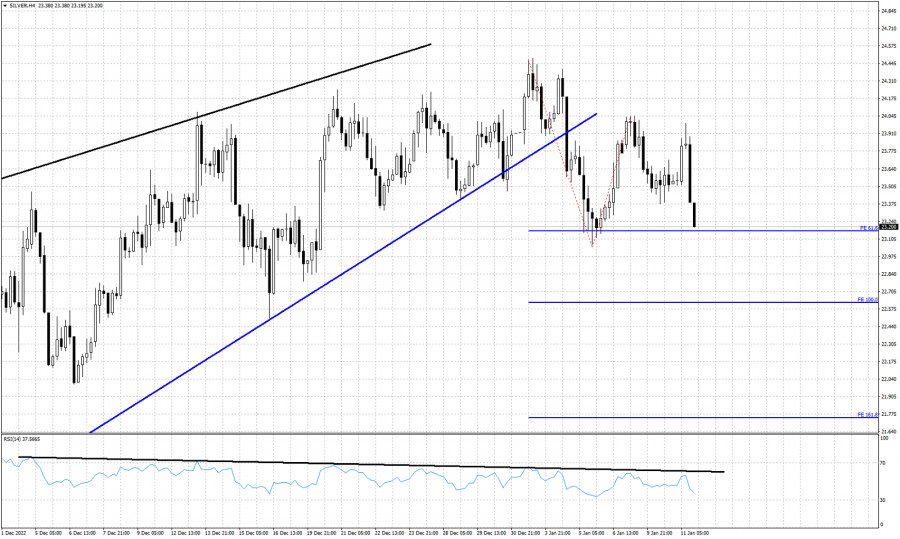
The Fibonacci extension targets are represented in the form of blue horizontal lines in the image below.
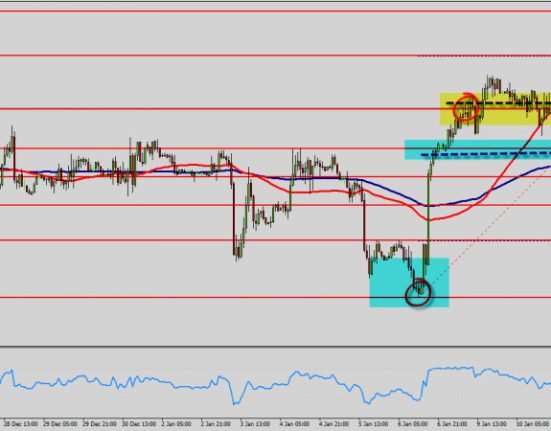
A support trend line is no longer intact when the blue line on the graph slopes upward.
The RSI (Relative Strength Index) is showing a bearish divergence, which is represented by a black line.
The silver market attempted to rally towards $24 but was unsuccessful in forming a higher high. Instead, a lower high was created and the current price is challenging the January lows of $23.06. At this point, silver is trading at $23.20, and if it breaches below $23.05, it has the potential to drop even further to our first target of $22.60. The resistance level stays at $24, and the support level at $23. After the bearish RSI divergence and the breakdown below the blue support line, we are still bearish on silver. Bears would not like to see silver prices above $24, as this would nullify the bearish pullback scenario.