Support & Resistance

Technical Analysis of Intraday Movement of USD/MXN Currency Pairs, Thursday January 12, 2023

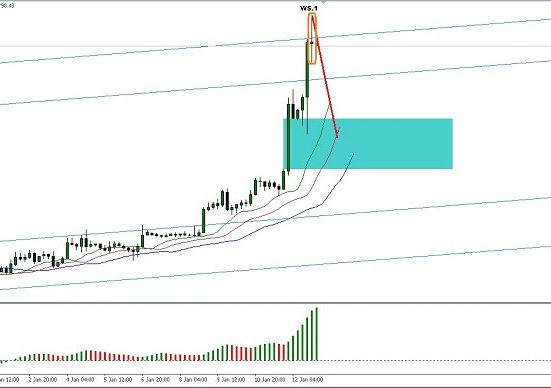
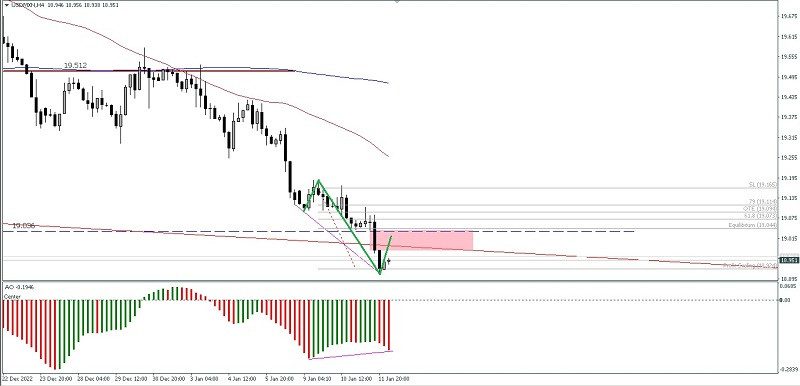
On the 4-hour chart, the USD/MXN currency pair appears to be attempting to correct an upward rally after breaking below the 19,036 level and the Awesome Oscillator indicator indicates that a downward move is imminent.

The area 18,980-19,039 must be tested before successfully heading to that region, but if USD/MXN drops below the 18,911 level again before reaching that region, the scenario described earlier will be invalidated and cancelled.

Andrew Johnson is a seasoned journalist with a keen interest in the commodity market. He is a regular contributor to Livemarkets.com, where he covers the latest news, trends, and analysis related to the commodity industry. With years of experience under his belt, Andrew has established himself as a reliable source of information on the global commodity market.